I know, I’m always complaining about the tides getting higher and the fact that I have only rare opportunities to find exposed mud in the tidal swamp. Well, I decided to pull the tide gauge report to show you this past month’s tide measurements on my local creek.
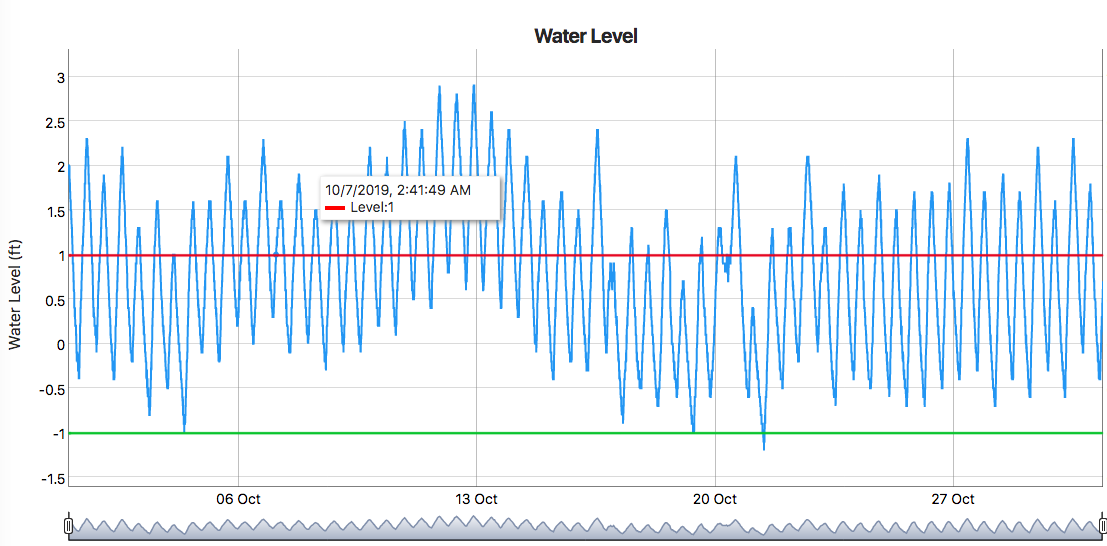
I added the red line to show where a “normal” high tide would be and the green line to show the “normal” low tide level, which is ideal for mudding.
I should mention that the chart scale is in feet. In mid October, the tides were nearly 2 ft (0.6 meters) above normal. It’s also worth mentioning that we had very little rain in October 2019, so none of these swings are a result of heavy rainfall, with the exception of the lack of any low tide on October 14 and 20. Most of the really low tides were before sunrise.
There is a seasonal component to the tide levels, as the moon sometimes passes directly overhead and other times it is much lower in the sky. For example, the June readings don’t quite reach 2.5ft but they are still well above normal. In any case, I don’t have historical data with which to compare since the gauge was just installed in the past 2 years, but I can tell you that this is as bad as it’s ever been, and the only thing I have to explain it is global sea level rise, which is only going to get worse.